Group Comparator
Compare Annotations in Groups of Re-analyzed Public Data
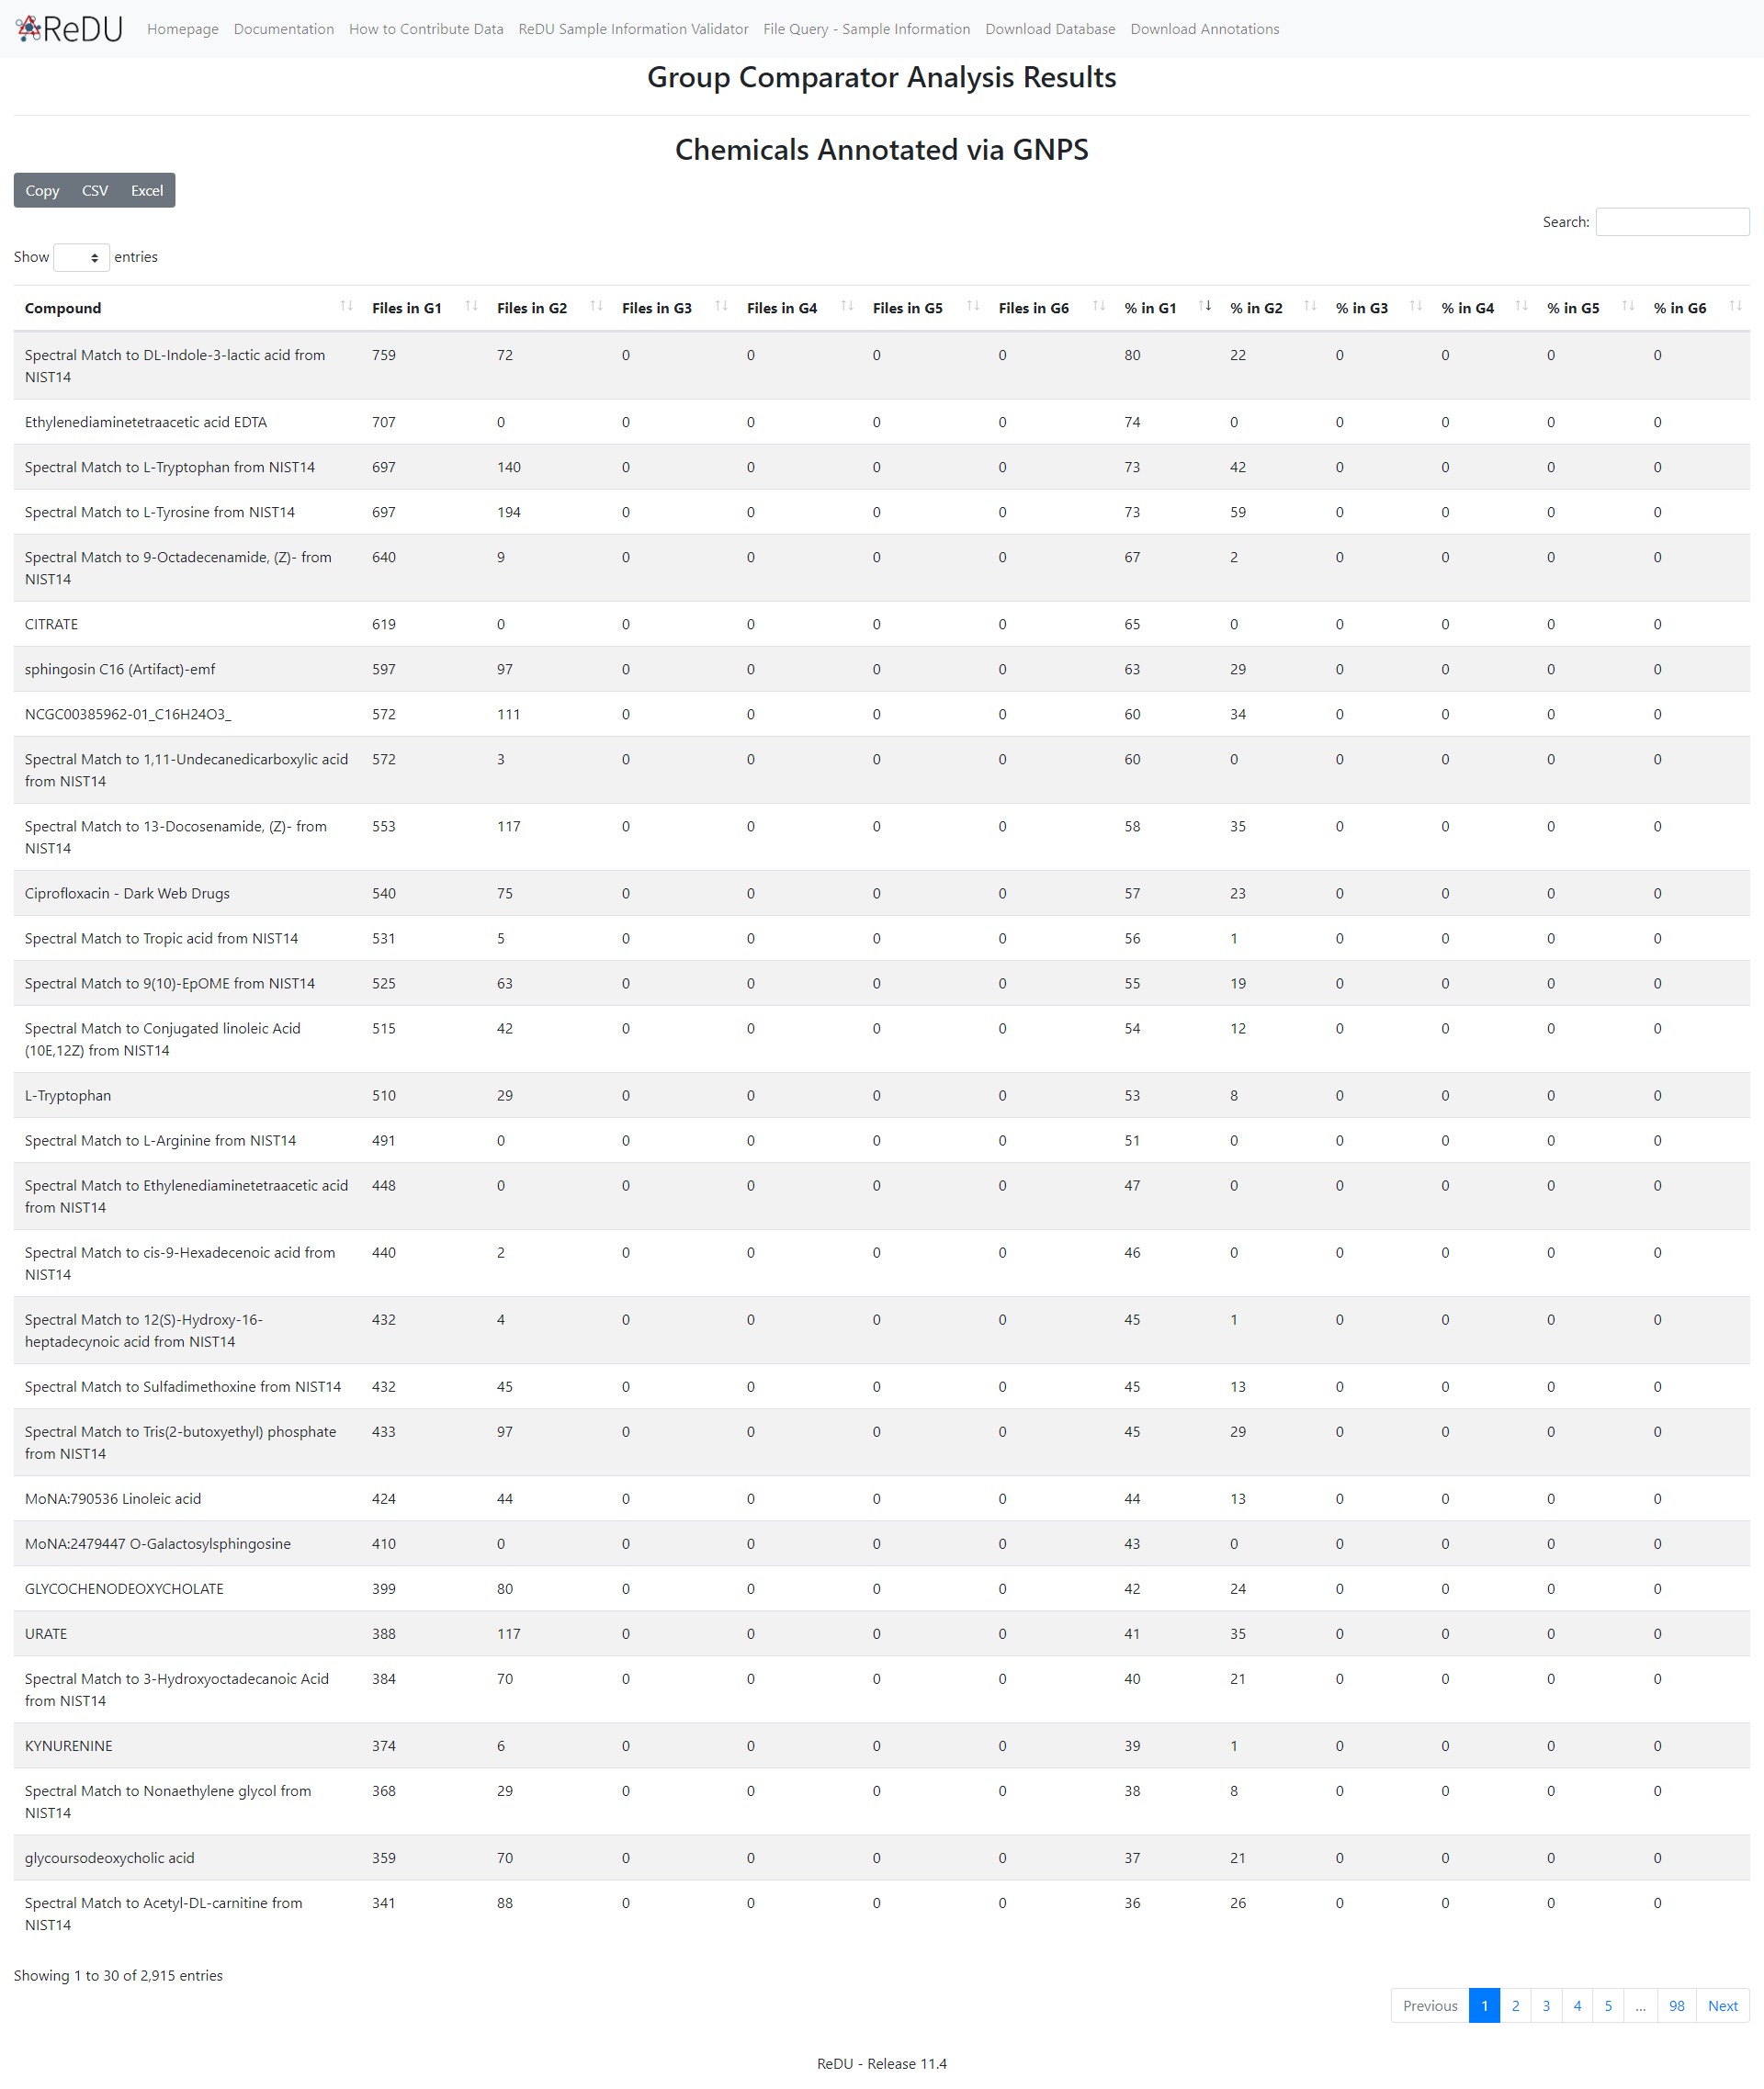
Summary
All chemical annotations that originate from the selected public data are tabulated with a button to view the sample information enrichment for each chemical annotated. Chemical annotation is performed in GNPS by comparing MS2 spectra, specifically product ion spectra, with reference MS2 fragmentation patterns (GNPS integrates of the majority of public reference MS2 spectra library). Default library search parameters are used. Sample information enrichment uses the sample information provided for each files by the community and users of ReDU-MS2.
Notes
- the selection of a large amount of files will slow down the in-browser visualization
- the use of the percentages are recommended for comparison between groups with different numbers of files.
Example Use Cases
- Explore associations between chemcials found in a subset of the public data and sample information in order to test or develop hypotheses. The information could be used to guide follow up analysis using public data that might be relevant.
Tutorial
- Navigate to the ReDU homepage.
- Click on the "Re-analyze Public Data at GNPS" text.
- Select the files you wish to include in the re-analysis by clicking the desired group button (i.e. G1-G6).
- The orange buttons in the center of the screen correspond to Sample Information categories.
- If filter/s are used, they will appear as red box/boxes in the Attribute Filters Panel (upper-right corner) of the page. To remove already selected filters click on the red boxed filter you wish to remove and the item should disappear from Attribute Filters Panel.
- When files are selected into a group the corresponding button becomes red and the number of files is updated in the Selection Summary Panel (upper-left corner).
- Click on the Launch Group Comparator button (blue) at the bottom of the page.
- The tabulated results can be sorted, searched, and downloaded.
- Example R code to generate plots is included in the ReDU GitHub repository - link here.
Last update: May 20, 2020 06:46:12