Metabolomics Data
Please let us know (miw023@ucsd.edu and ajarmusch@ucsd.edu) if you have any datasets for SARS-CoV2) data. We are currently analyzing MERS data below.
Page last revised on: 2020-05-18
SARS-CoV-2 Metabolomics Serum Data
The RAW data can be found here. MSV000085373
with metadata found here.
Feature Detection
We used this MZmine2 batch file.
Feature Based Molecular Networking
The Feature Based Molecular Networking Job can be found here.
Here is a high level molecular network analysis...
Lorem Ipsum...
PCoA Analysis
Lorem Ipsum...
Statistical Analysis
Lorem Ipsum...
MERS Lipidomics Data
There are many datasets from the following publications
The raw lipidomics data as a start can be found in MassIVE:
- Primary human airway epithelial cells lipidome response to an icMERS coronavirus MHAE003 - MSV000083535
- Primary human airway epithelial cells lipidome response to an icMERS coronavirus - MSV000083534
- Primary human airway epithelial cells lipidome response to an icMERS coronavirus - MSV000083533
These data from Thomas O. Metz's Lab from PNNL are time course studies of the lipidome of the airway epitheleal tissue.
We have compiled the metadata from the data here.
Initial Metabolomics Analysis
Qualitative Analysis
| Dataset | Analysis |
|---|---|
| MSV000083535 | Spectral Library Search |
| MSV000083535 | Classical Molecular Networking |
| MSV000083535 - Positive | Qemistree |
Relative Quantitative Analysis
| Dataset | Feature Detection | FBMN | Data API | Esquisse |
|---|---|---|---|---|
| MSV000083535 - Positive Data | Analysis | Analysis | API | Link |
| MSV000083535 - Negative Data | Analysis | Analysis | API | Link |
This API data is a tall tabular csv file with feature and sample metadata pulled into it. It is readily plotable in tools like ggplot2 (R) and plotnine (python). You can read it into your software in a single line:
pd.read_csv("https://proteomics3.ucsd.edu/ProteoSAFe/DownloadResultFile?task=3ed2ee9297ed47f09b42825370895ee9&file=feature_statistics/data_long.csv")
Preliminary Results
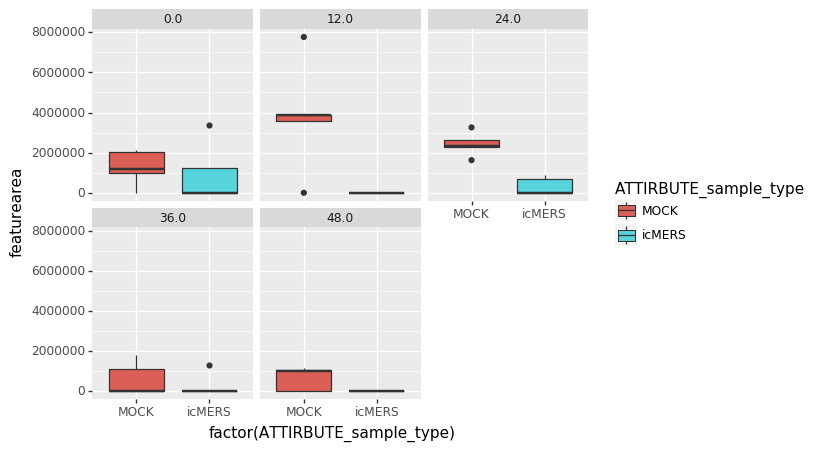
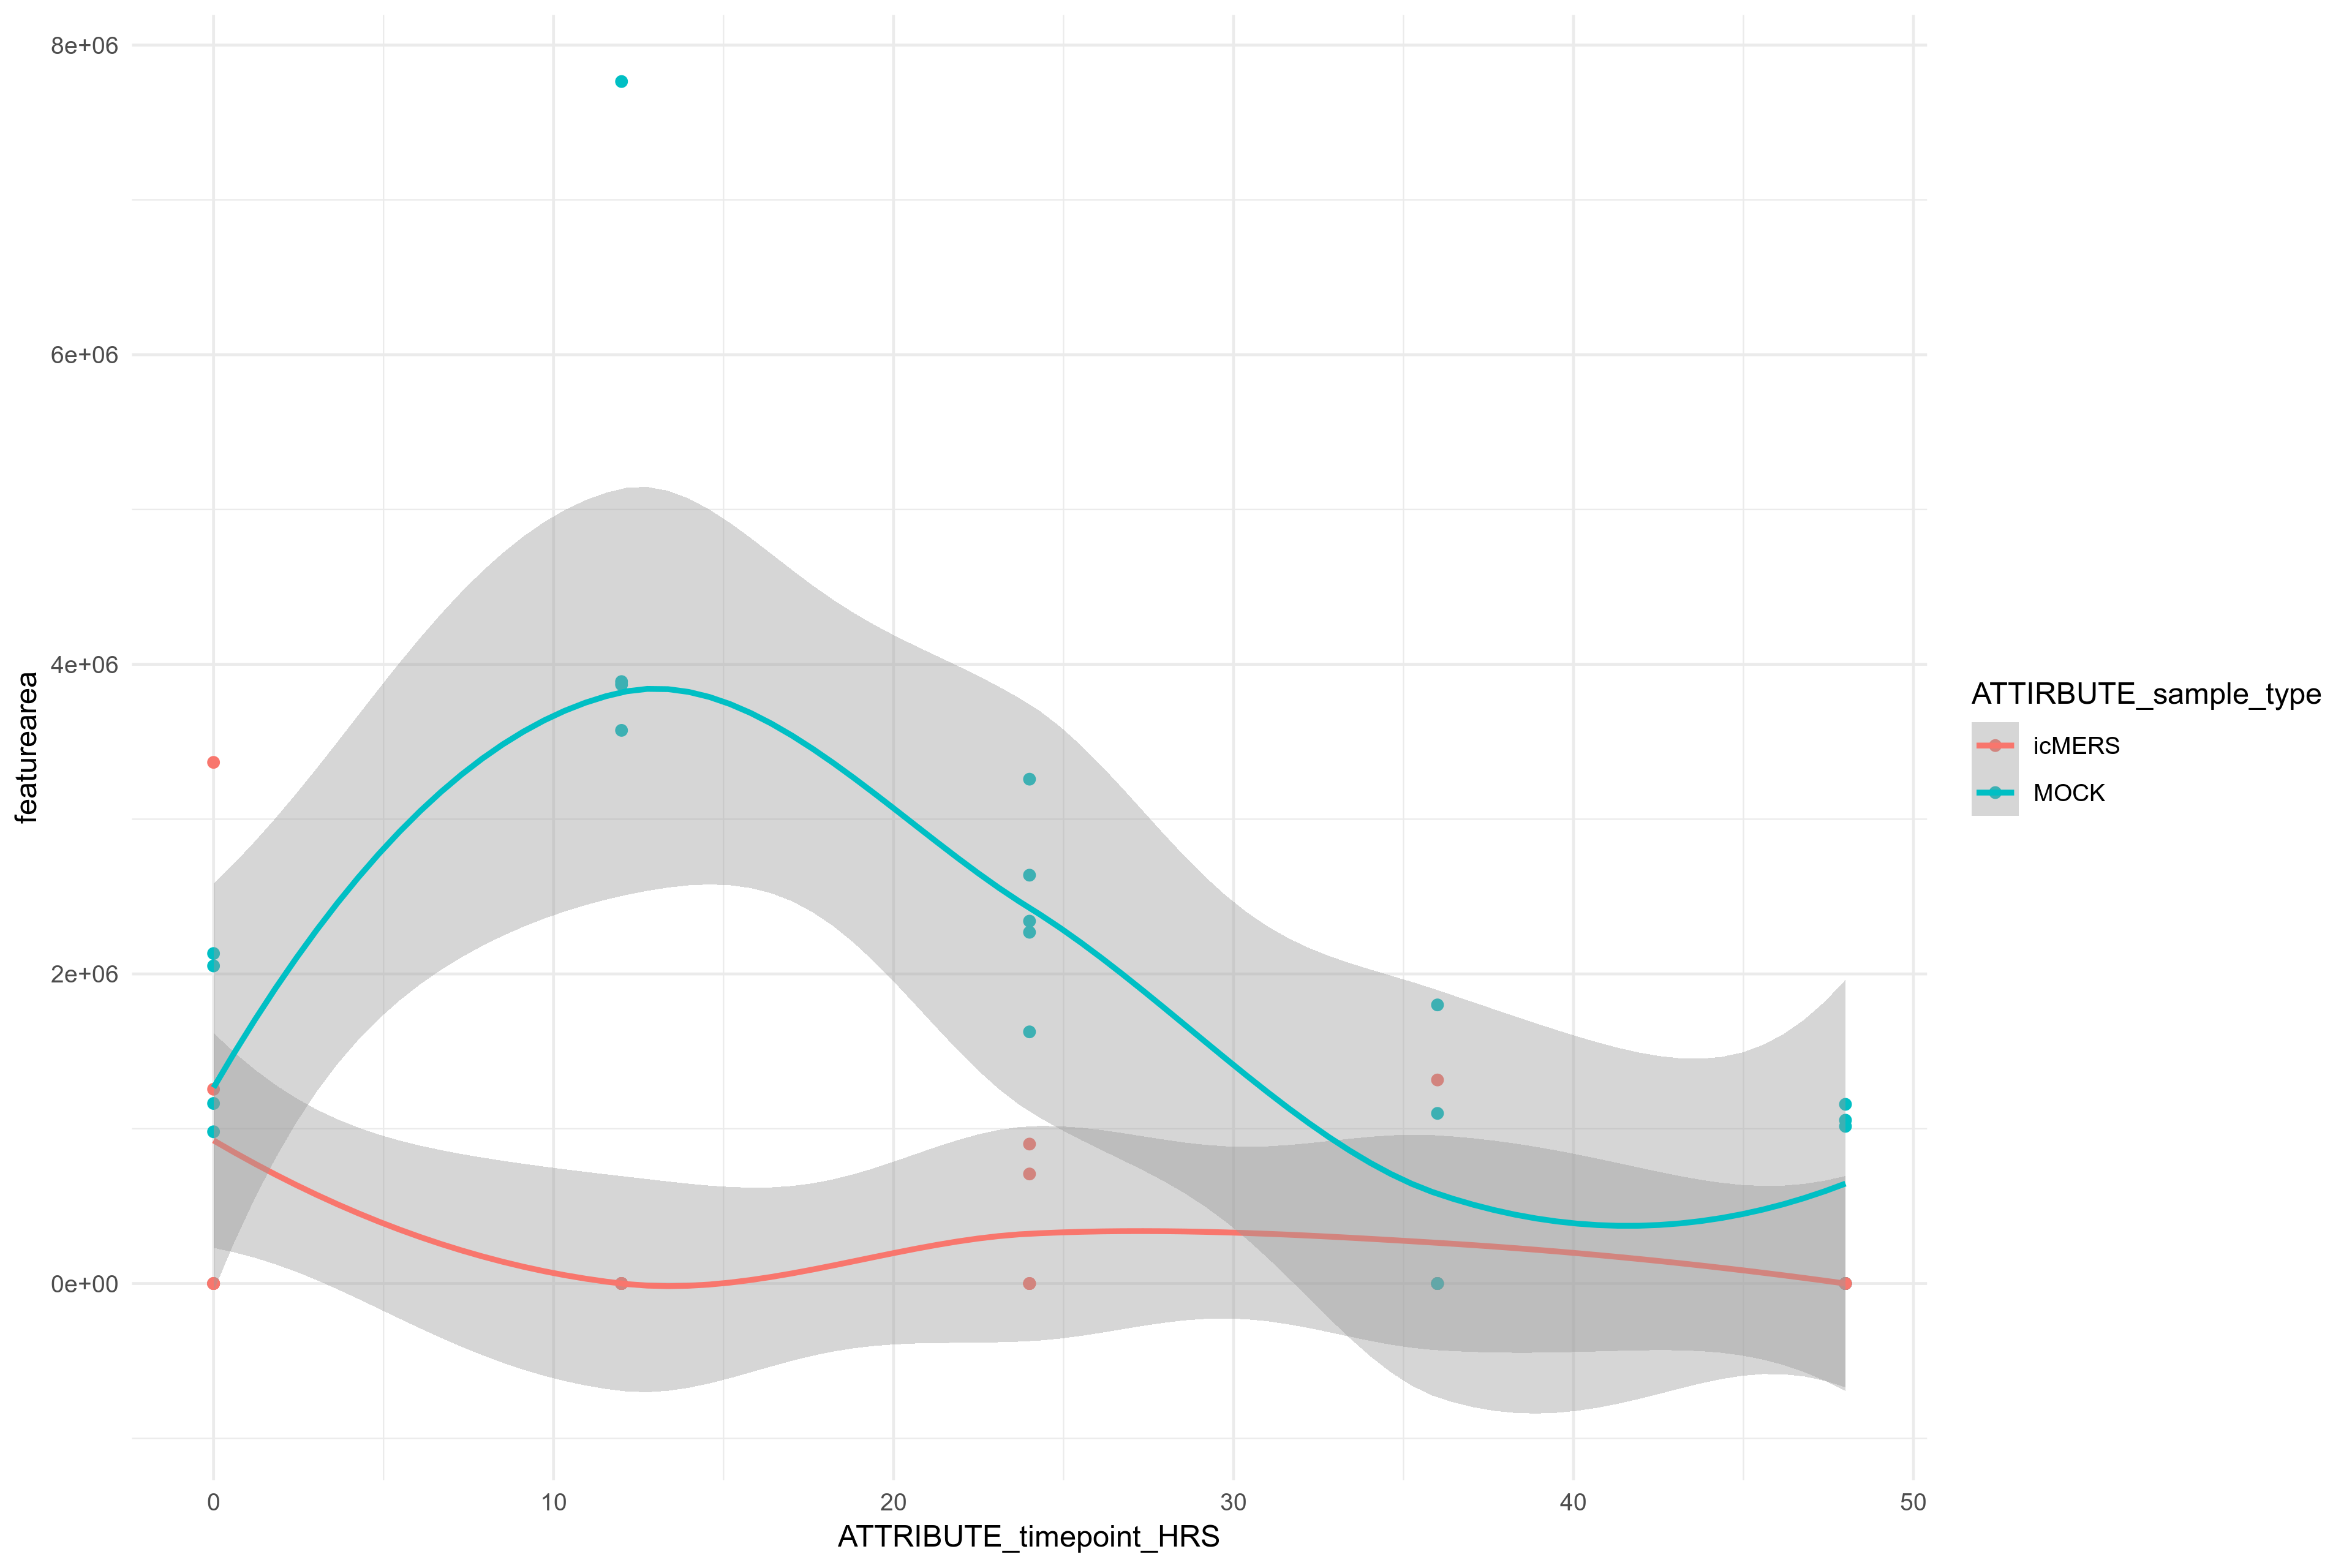
Positive Ionization Results - sorted by p-value between mock and MERS
Example Feature 8378 across different time points of infection:
Molecular Network - highlighting significant features in MOCK (purple) vs iMERS
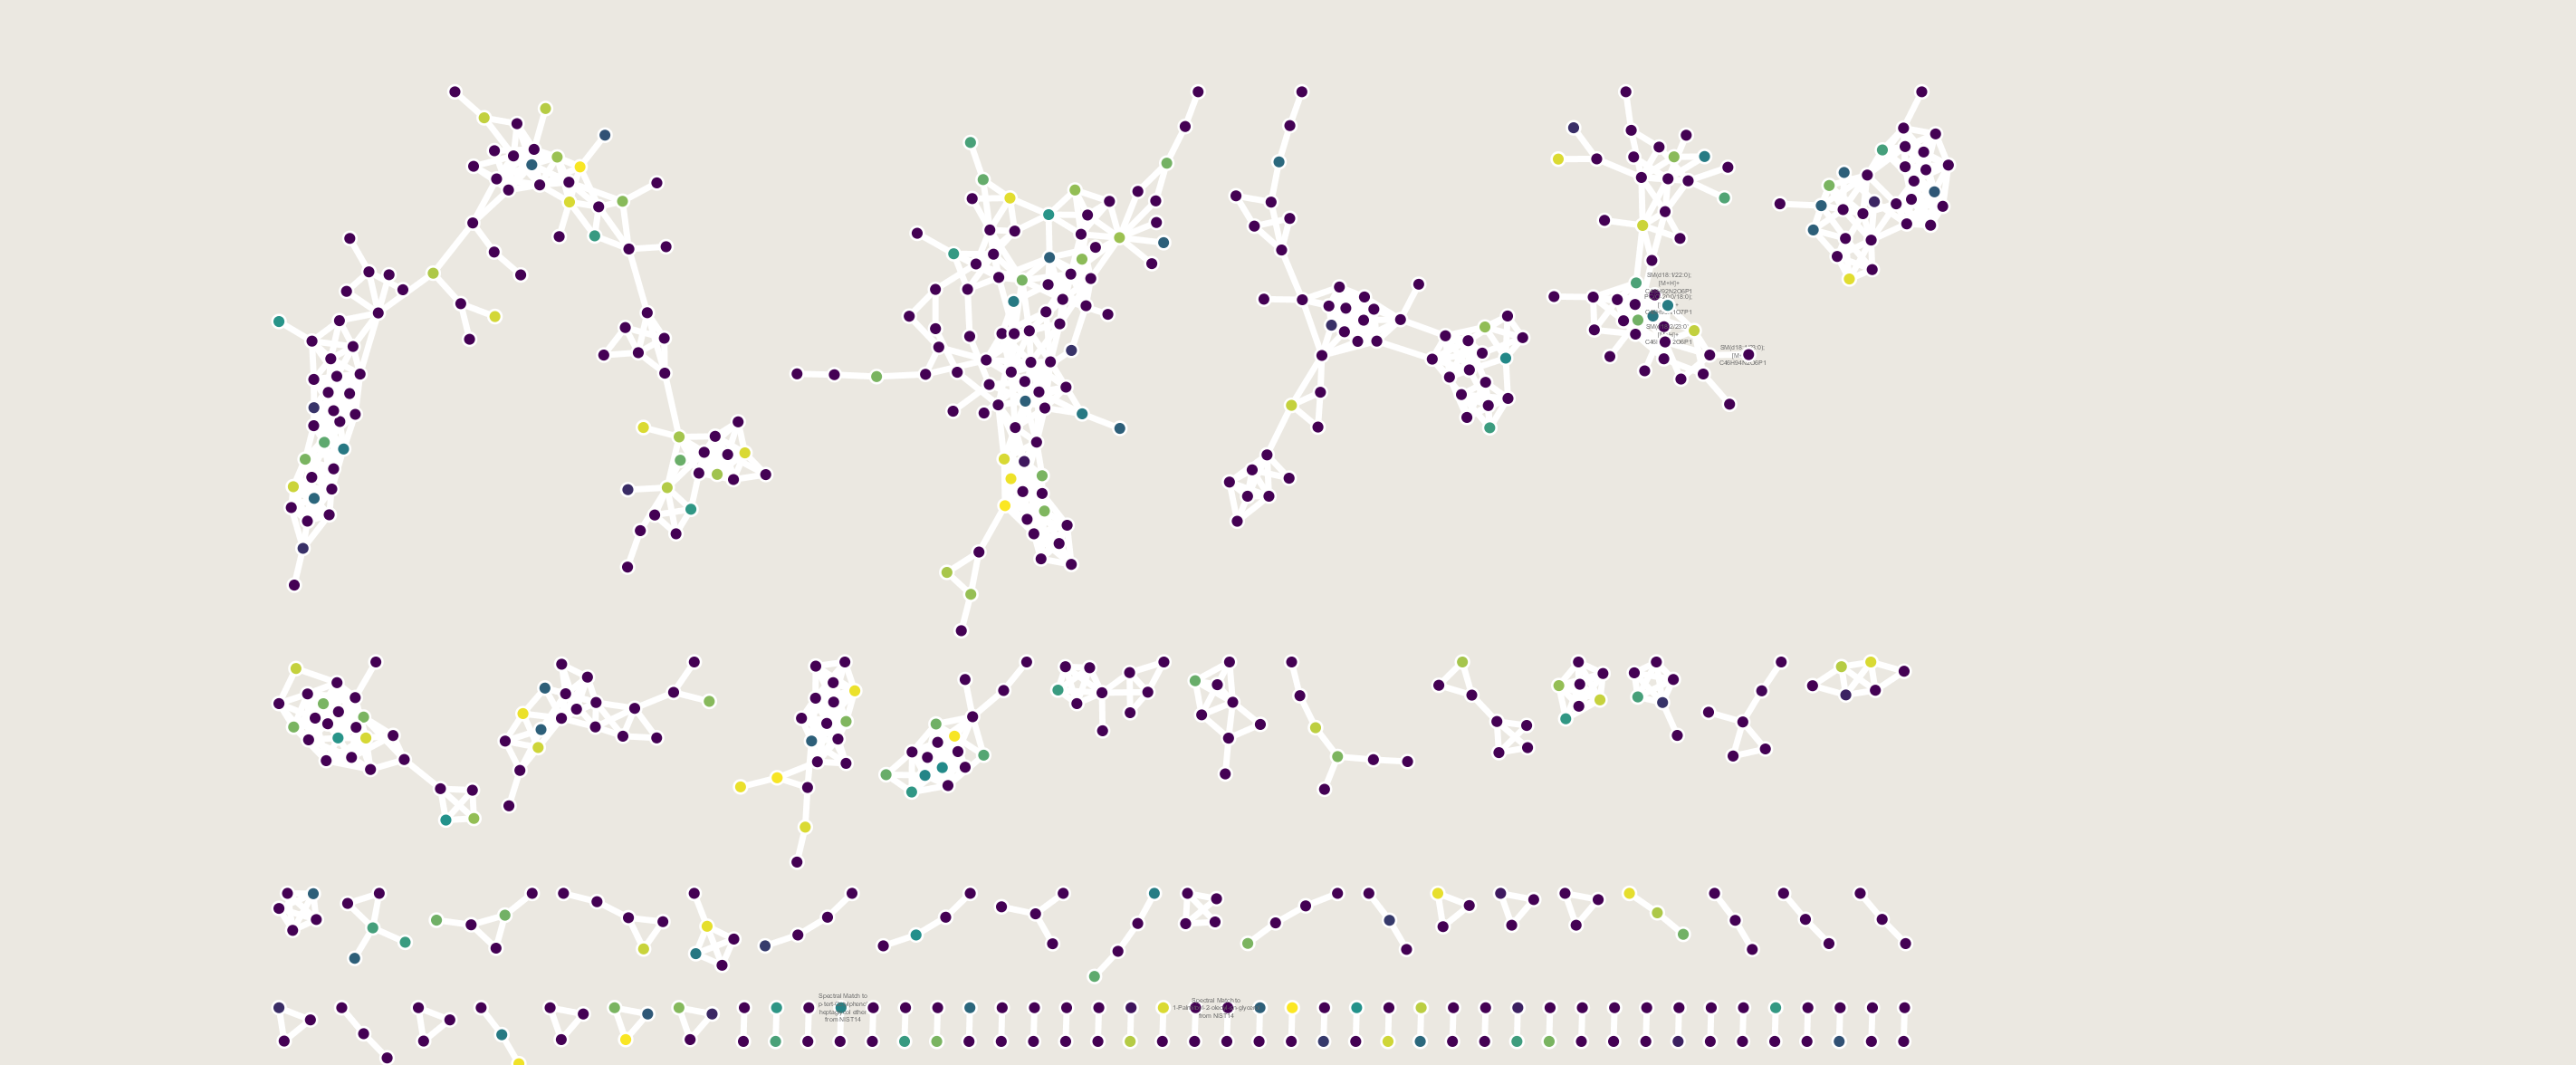
Download entire network here
Data Processing Methods
We aim to imploy the following analysis pipeline:
- Feature Finding with MZmine2 in GNPS - Produces peak integration from data
- Feature Based Molecular Networking in GNPS - Produces Molecular network and spectral library matches - machine readable quantitative data
- Statistical Analysis and exploration via Jupyter Notebooks
MERS GC Data
There are many datasets from the following publications
The raw GC Metabolomics data as a start can be found in MassIVE - Primary human airway epithelial cells metabolome response to an icMERS coronavirus
We have compiled the metadata from the data here.
Initial Metabolomics Analysis
Relative Quantitative Analysis
| Dataset | Analysis |
|---|---|
| MSV000081889, MSV000081890, MSV000081891 (combined) - Cos0.7 | Spectral Library Search |
| MSV000081889, MSV000081890, MSV000081891 (combined) - Cos0.7 | Deconvolution |
| MSV000081889, MSV000081890, MSV000081891 (combined) - Cos0.7 | Network |
| MSV000081889, MSV000081890, MSV000081891 (combined) - Cos0.5 | Spectral Library Search |
| MSV000081889, MSV000081890, MSV000081891 (combined) - Cos0.5 | Network |
Some preliminary results can be found here