Using SMART
User's Guide for SMART 2.0 Analysis
Welcome to use the SMART 2.0 to test your compound(s) @ SMART 2.0.
- The current version of SMART 2.0 as of 11/25/2019 consists of 2D NMR spectra from 53,076 natural products.
- Before you start, please unblock any pop-up blockers in your web browser for smart.ucsd.edu website.
- One SMART 2.0 analysis should take < 20 seconds (if still 'analyzing' double check your input, see chapters Supported Formats for SMART Analysis and Troubleshooting).
- You can run multiple (up to 10) analyses at once.
- If your results are dissatisfying please try to process your data again manually (go to How to process a raw HSQC spectrum to a NMR table and then delete noise and duplicate annotations, add peaks missed by auto-peak picking etc.)
How to process a raw HSQC spectrum to a NMR table with MestreNova (version 12 and newer)
- Open your raw HSQC spectrum in MestreNova (preferences: modern view)
- Drag&Drop your HSQC file (for Bruker data you find your spectrum under: pdata/1/2rr)
- Depending on purity and concentration of your sample and aquisition time your
spectrum looks more or less clean and may need additional processing (see 2.)

- For processing your HSQC spectrum click on 'Processing' tab
- click on 'Auto Phase Correction' (optional: correct manually)
- click on 'Auto Baseline Correction'
- click on 'More Processing' --> click on 'Reduce t1 noise'
You should see a clean spectrum now.

- Annotate HSQC spectrum with chemical shifts (1H,13C)
- click on 'Analysis' tab
- click on Auto Peak Picking (Important: Check by manually adding missed peaks and removing duplicated, nonsense and solvent peak annotations).
Now each peak should be annotated with two numbers separated by comma (1H, 13C chemical shifts)

-
Generate NMR table from annotated HSQC spectrum
- click on 'Analysis' tab
- click on 'NMR Peaks Table'
- move the f2 column to the left of the f1 column
- right click on table, setup report, setup table
- customize table by unchecking every value but for f2 (change visible name to 1H) and f1 (change visible name to 13C)
- change number of decimals for f1 to '1'
- copy all (ctrl+A)
- click on 'copy peaks' and choose 'copy table'
-
a) Generate NMR table from annotated HSQC spectrum
- open Excel or similar program and paste the table (ctrl+V)
- copy and paste the table so that all values with 1H data are in column A2-AX and all values with 13C data are in column B2-BXX
- mark your table + header (1H,13C) and save as comma-separated file (.csv).
or
- b) Run SMART Analysis directly
- copy and paste the table (ctrl+V) directly to the peak list section of https://smart.ucsd.edu/classic
- Important: Apply one backslash to remove the additional space character that is imported with the NMR table'
- Click on 'Analyze entered peak list'

You are ready to use SMART 2.0 Analysis! :)
Please feel free to play around with the processing parameters such as including/excluding noise signals or signals from other minor compounds in case of mixtures or explore the differences of SMART results when referencing your spectra compared to tables without referencing. Overall SMART is designed to be very robust towards any of these changes as its training is not only based on the absolute position of the peaks, but the relative position of each peak towards every other peak (see also References 1 + 2).
Input Data Formatting using MestreNova
Please prepare your NMR peak lists of each compound using Excel or preferably notepad/wordpad and save the NMR table of each compound as a comma-separated value (.csv) or tab-separated value (.tsv) file. Furthermore, SMART does now support peaklists from TopSpin. Please always place 1H data in the first column and their corresponding 13C data in the second column. The first row will be left for strings “1H” and “13C” as table head. Please strictly keep 1H shifts in 2 decimals and 13C shifts in a single decimal only. You can name the .csv file with any name that your operating system accepts.
| 1H | 13C |
|---|---|
| 3.00 | 29.0 |
| 3.40 | 29.0 |
| 5.00 | 57.6 |
| 5.60 | 59.4 |
| 1.80 | 19.2 |
| 5.17 | 57.4 |
| 7.49 | 129.0 |
| 7.51 | 130.5 |
| 7.47 | 131.4 |
In the NMR table files, wherever there are diastereotopic protons on a methylene carbon (i.e., CH2 with two distinct proton shifts), please add a separate entry for both the carbon and proton:
| 1H | 13C |
|---|---|
| 3.12 | 43.2 |
| 3.40 | 43.2 |
Supported Formats for SMART Analysis (MestreNova)
SMART supports CSV and TSV formats for analysis. You can check your .csv or .tsv file by opening it with text editors such as wordpad or notepad. Your table should appear like this:
1H,13C
1.09,14.3
2.21,22.2
3.41,56.9
7.21,128.6
7.29,123.4

or for .tsv:

1H  13C
1.09    14.3
2.21    22.2
3.41    56.9
7.21    128.6
7.29    123.4
Supported Formats for SMART Analysis (TopSpin)
SMART supports peaklists created with TopSpin. After finishing the second Fourier-transform of the collected FID data of your HSQC experiment, type and execute "pp" in the command line, and then check the box "Export results as XWinNMR peak list". The peaklist file should appear in the "/nmrdata/pdata/1" or similar directory. You can check your file by opening it with text editors such as wordpad or notepad. Your table should appear like this:
# PEAKLIST_VERSION 1.1
# PEAKLIST_DIMENSION 2
# 2018-08-29T17:01:17  Jmegan
# DU=ACTIVE_Directory_Here, USER=USER_Listed_Here, NAME=HND_Erythromycin, EXPNO=13, PROCNO=1
# Manually picked peaks

 #     F2#     F1#           F2[ppm]           F1[ppm]       Intensity       Annotation

 0  1210.0  1060.1            4.7338           95.9132       709852.72       CLADINOSE POSITION 1
 1  1264.2   999.1            4.3624          102.1460       499402.69       DESOAMINE POS 1
 2  1312.7  1363.8            4.0309           64.8258       528833.94       CLADINOSE POSITION 5
 3  1317.5  1226.2            3.9979           78.9063       264385.22       POSITION 3
 4  1351.5  1324.6            3.7653           68.8385       480563.38       POSITION 11
 5  1373.4  1341.2            3.6151           67.1395       421375.75       DESOAMINE POS 5
 6  1393.5  1188.7            3.4779           82.7446       371510.38       POSITION 5
 7  1459.2  1306.2            3.0283           70.7262       273080.81       DESOAMINE POS 2
 8  1478.7  1240.4            2.8947           77.4590       791924.38       CLADINOSE POSITION 4
 9  1433.1  1519.8            3.2067           48.8705      1153560.91       CLADINOSE POSITION 8
 10  1482.0  1582.5            2.8722           42.4534       218659.72       POSITION 10
11  1484.2  1612.4            2.8568           39.3885       364326.19       POSITION 8
12  1498.2  1563.3            2.7610           44.4169       450605.22       POSITION 2
13  1542.4  1368.0            2.4584           64.3968       151326.44       DESOAMINE POS 3
14  1569.4  1655.8            2.2738           34.9470      -205451.38       CLADINOSE POSITION 2 A
15  1681.7  1655.8            1.5049           34.9470      -298519.94       CLADINOSE POSITION 2 B
16  1626.0  1615.5            1.8865           39.0700       159692.31       POSITION 4
17  1653.1  1623.8            1.7012           38.2192      -105972.31       POSITION 7A
18  1716.1  1621.3            1.2700           38.4810      -118139.16       POSITION 7B
19  1668.1  1703.8            1.5983           30.0387      -124150.16       DESOAMINE POS 4A
20  1740.0  1703.1            1.1059           30.1042       -83278.84       DESOAMINE POS 4B
21  1157.1  1256.5            5.0959           75.8126       261669.59       POSITION 13
22  1638.9  1789.9            1.7982           21.2245      -181342.06       POSITION 14A
23  1701.6  1792.3            1.3686           20.9827      -170774.62       POSITION 14B
24  1749.2  1822.4            1.0428           17.8988       320386.66       POSITION 19
25  1756.8  1821.8            0.9914           17.9592       350921.56       POSITION 21
26  1734.9  1815.9            1.1407           18.5639       430343.31       CLADINOSE POSITION 7
27  1728.2  1815.3            1.1871           18.6244       442255.47       CLADINOSE POSITION 6
28  1791.0  1892.2            0.7570           10.7603       665430.09       POSITION 15
29  1745.2  1789.6            1.0706           21.2570       854179.56       DESOAMINE POS 6
30  1753.4  1907.2            1.0143            9.2231       469380.50       POSITION 17
31  1749.0  1887.5            1.0447           11.2434       576280.69       POSITION 20
32  1746.3  1844.5            1.0632           15.6353       144643.59       POISTION 16
Submit CSV or TSV file, or TopSpin peaklist for SMART Analysis
After the .csv or .tsv file or TopSpin peaklist is ready, simply upload it to the first window by drag&drop (analysis automatically starts) or copy and paste the table and click analyze. You can submit multiple jobs at one time. Important: You have to allow pop-ups for https://smart.ucsd.edu/classic. If your analysis is still running after 20 seconds, pop-up blockers are the most likely reason why your analysis failed. The result will show up in the next webpage as images with chemical structures, compound names, similarity scores, and molecular weights. The Top 100 hits are ranked by similarity scores. You can download the result by clicking the “download results” icon and open it with Excel.
Troubleshooting
Overview
This section addresses some common issues with the analysis workflows at SMART. If you run into any of these common issues, hopefully this page will give you actionable steps to address them. If this page cannot help you, please refer to the forum to help answer your questions.
SMART Analysis
Failed Job
- If your analysis is still running after 20 seconds, pop-up blockers are the most likely reason why your analysis failed. You have to allow pop-ups for https://smart.ucsd.edu/classic.
- The file format input is incorrect. Please make sure it is a supported file format for SMART (see Input Data Formatting) When you enter the peak list as tab-separated or comma-separated table make sure that the first row is: 1H,13C or 1H 13C, respectively. Do NOT include any additional spaces or " signs. Especially, if you copy&paste your table directly from MestreNova, apply one backslash to remove the additional space character that is imported with the NMR table
Downloaded Results file cannot be opened
Yes you can :) You can open the downloaded results with any text editor (Excel, Notepad, Wordpad). Just make a right-click on the file, click on 'open with' and then choose one of the former mentioned programs.
Results Incorrect
The SMART is still at its early stage of development. It will become more and more accurate the more spectra you contribute to the Moliverse (see Contribute to SMART). - If your results show strange suggestions and all of the have a cosine score of 1.0 you probably have switched the columns. Please be sure that your first column has proton shifts (1H) and your second column has carbon shifts (13C), where each 1H-13C pair is separated by a comma. - If your CSV file won't show exactly two decimals for 1H, or exactly a single digit for 13C, you can mannually change the last digit of the chemical shift from 0 to 1. E.g., change 7.30 to 7.31. Slight variation of the last digit won't affect your test result.
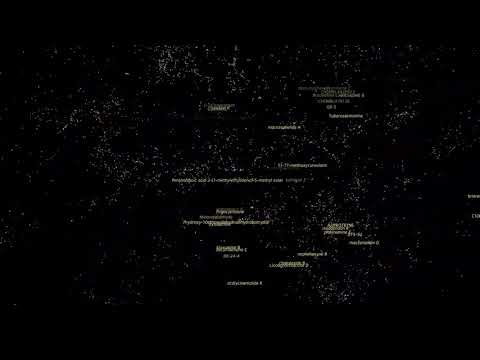
Visualize your result(s) in the 3D cluster space (Moliverse)
Please click the "Embed in the Moliverse" bar in the upper right side of the result page. Wait a while for the Embedding Projector to launch. To find your query molecule, please type "query" in the search bar in the upper right side of the Embedding Projector Webpage. Naturally, your query compound as well as its 100 closest analogues will light up in unique colors (decreasing cosine similarity will be displayed by purple-red-orange-yellow).
- To better observe the clustering effect, please click UMAP or T-SNE tabs in the lower left window. The clusters will organize themselves in real-time, clustering more similar compounds in close proximity and more dissimilar compounds apart from each other.
- Further you can access and enjoy the whole 'Moliverse' under https://smart.ucsd.edu/classic (click on 'Explore Moliverse')
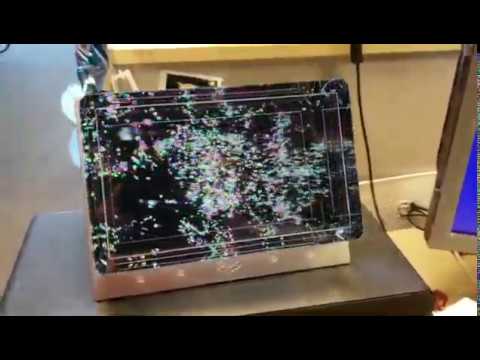
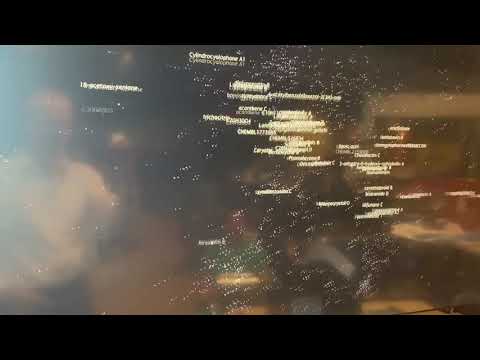
Visualize the 3D cluster space (Moliverse) with VR devices
Please click Video_1, Video_2 and Video_3 to watch the VR movie. The VR software will be delivered soon!
Contact
If you have any questions about how to use SMART please first ask the community at the SMART forum located here: forum. We will respond you as soon as we can. If you woud like to access our to-be-online SMART 3.0, please email Hyunwoo Kim (hwkim at-sign ucsd dot edu) for off-line trials.
References
To reference the system please cite the papers listed below.
-
Zhang C*, Idelbayev Y*, Roberts N, Tao Y, Nannapaneni Y, Duggan BM, Min J, Lin EC, Gerwick EC, Cottrell GW, Gerwick WH. Small Molecule Accurate Recognition Technology (SMART) to Enhance Natural Products Research. Scientific Reports. 2017, 7(1), 14243. DOI: 10.1038/s41598-017-13923-x *These authors contributed equally to this work.
-
Reher R*, Kim H*, Zhang C*, Mao HH, Wang M, Nothias LF, Caraballo-Rodriguez AM, Glukhov E, Teke B, Leao T, Alexander KL, Duggan BM, Van Everbroeck EL, Dorrestein PC, Cottrell GW, Gerwick WH. A Convolutional Neural Network-based approach for the Rapid Characterization of Molecularly Diverse Natural Products. Journal of the American Chemical Society. 2020, 142(9), 4114-4120. DOI: 10.1021/jacs.9b13786 *These authors contributed equally to this work.
-
Coming soon...
