MassQL Introduction
![]()
About Mass Spec Query Language
The Mass Spec Query Langauge (MassQL) is a domain specific language meant to be a succinct way to express a query in a mass spectrometry centric fashion. It is inspired by SQL, but it attempts to bake in assumptions of mass spectrometry to make querying much more natural for mass spectrometry users. Broadly we attempt to design it according to several principles:
- Expressiveness - Capture complex mass spectrometry patterns that the community would like to look for
- Precision - Exactly prescribe how to find data without ambiguity
- Relatively Natural - MassQL should be relatively easy to read and write and even use as a way to communicate ideas about mass spectrometry, you know like a language.
Why does Mass Spec Query Language Exist?
The intrinsic physical and chemical property of molecules when analyzed by mass spectrometry imprint patterns upon mass spectrometry data. This affords the opportunity to formulate queries to find these patterns in raw mass spectrometry data. However, within the computational mass spectrometry ecosystem, the lack of a ergonomic, flexible, and scalable approach to express these patterns prevents the community from taking full advantage of expert knowledge of these patterns to thoroughly and quickly mine mass spectrometry data for new molecules. Therefore, I created the Mass Spectrometry Query Language (MassQL) to empower mass spectrometrists and chemists to write their own queries in a flexible, precise, and scalable fashion.
Developers
Mingxun Wang is the creator and main developer of MassQL. Please contact me if you have questions! I'm hoping this becomes a community effort so reach out if you want to help/use MassQL.
Definition of a Query
There are several parts
QUERY
<Type of Data>
WHERE
<Condition>
AND
<Condition>
FILTER
<Filter>
AND
<Filter>
Type of Data
This determines the type of data you want to get. At its most fundamental level, its the peaks for either
- MS1DATA
- MS2DATA
Further, there are functions that can modify this data
- scaninfo - This provides likely the most information you'd want for each scan
- scansum - Summation of the scan (TIC)
- scannum - Returns the scan number
- scanmaxint - Returns the max intensity per spectrum (BPI)
Experimental Functions
- scanrangesum
- scanmaxmz
- scanrun
Conditionals
These are conditions to filter for scans of interest (by looking for peaks and sets of peaks) within the mass spectrometry data. You can create clauses,
which are specific conditions and the associated qualifiers. You may further combine multiple conditions with AND. AND will indicate that within a specific spectrum, all the conditions must be met.
Info
The syntax for this is <condition>=<value>, e.g. MS2PROD=144.1.
The types of conditions are as follows
RTMIN
Setting the minimum retention time in minutes
RTMAX
Setting the maximum retention time in minutes
SCANMIN
Setting the minimum scan number (this is inclusive)
SCANMAX
Setting the maximum scan number (this is inclusive)
CHARGE
Finding MS2 spectra with a given charge if reported by the instrument
POLARITY
The polarity that will be chosen. (Positive, Negative)
MS2PROD
Looking for an MS2 peak
MS2PREC
Looking for an MS2 precursor m/z
MS1MZ
Looking for MS1 peak m/z
MOBILITY
We have a special keyword to interact with mobility data. Specifically, the syntax enables you to set min and max bounds for the mobility
MOBILITY=range(min=1, max=2)
The units here are whatever your mass spectrometer reports and are not converted to collision cross section (CCS).
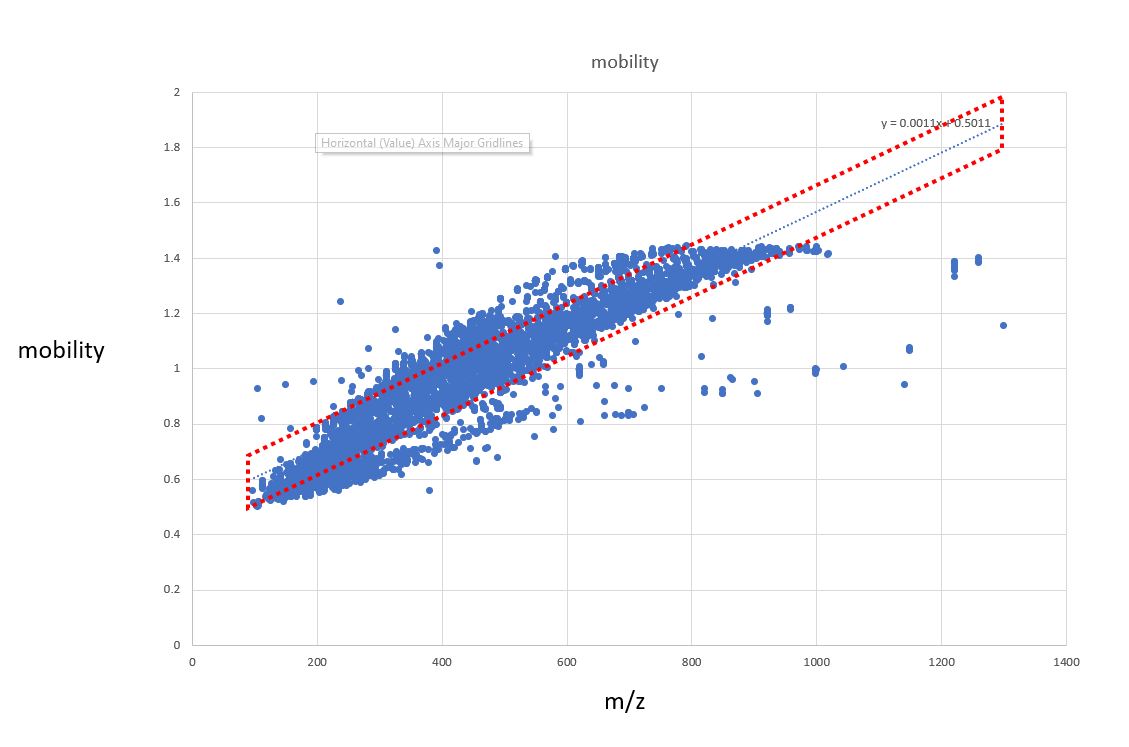
Fun with m/z variables and Mobility
You can even create polygons within the m/z mobility space to get data. Here is a quick example
QUERY scaninfo(MS2DATA) WHERE MS2PREC=X AND MOBILITY=range(min=X*0.0011+0.5-0.1, max=X*0.0011+0.5+0.1)
MS2NL
Looking for a neutral loss from precursor m/z in the MS2 spectrum. For example, if a molecule has a precursor m/z of 500, and you are searching for an MS2NL of 16, it will look for a peak appearing at 500 - 16 = 484 m/z.
Qualifiers
These can be attached to conditions to modify some properties about the peaks we are looking for.
Mass Accuracy
These two fields enable setting a peak m/z tolerance
TOLERANCEMZ=0.1
TOLERANCEPPM=50
Default Values
The default tolerance when no qualifier is provided is 0.1 Da.
Intensity Relative to Full Spectrum
These two fields enable to set an minimum intensity
INTENSITYVALUE=1000
INTENSITYPERCENT=10
INTENSITYTICPERCENT=10
INTENSITYVALUE - This indicates a minimum intensity value in terms of arbitrary units. INTENSITYPERCENT - This indicates a minimum percent of maximum peak in the spectrum. INTENSITYTICPERCENT - This indicates a minimum percent of total TIC in the spectra.
Default Values
The default minimum intensity value is 0, so it will accept any peak. This is generally not what you want, so likely you do want to set this.
Intensity Relative to Other Peaks
Here we can start imposing relative intensities between peaks
INTENSITYMATCHREFERENCE
INTENSITYMATCH=Y
INTENSITYMATCH=Y*2
INTENSITYMATCHPERCENT=10
Intensity Matching Between Peaks
This is actually complicated, but you'll end up with one peak per variable that is the reference and all others are relative to that reference.
WHERE
MS1MZ=X:INTENSITYMATCH=Y:INTENSITYMATCHREFERENCE # This is the reference peak which all other peaks' intensities will be compared to
AND
MS1MZ=X+2:INTENSITYMATCH=Y*2:INTENSITYMATCHPERCENT=1 # The Y*2 denotes that it must be 2 times the intensity of the first peak
Exclusion Qualifier (NOT)
We have a mechanism to invert the selection of a condition. You can simply add an :EXCLUDED qualifier onto a condition to exclude, and in boolean logic function as a NOT, that specific condition. Here is a more complete example:
QUERY scaninfo(MS2DATA) WHERE MS2PROD=226.18:TOLERANCEPPM=5:EXCLUDED
Values of Conditions, Qualifiers
As mentioned above, the value of certain conditions can be numbers (more precisely floats). However, its sometimes in convenient to have to actually calculate out the m/z for an MS2PROD condition and also the derivation is obfuscated if its just a single number. You can simply list it out as a numerical expression
MS2PROD=100+14
and this will get calculated to mean
MS2PROD=114
You can even do more advanced things that are native to chemistry/biochemistry without having to look up numbers, and they are listed below.
MS2MZ and MS2PROD synonyms
MS2MZ and MS2PROD mean the same thing in the language.
ANY keyword
If you do not have a specific requirement of a peak m/z, you can use the ANY keyword.
For example:
MS2PROD=ANY:MASSDEFECT=massdefect(min=0.1, max=0.2)
Variables
In cases where you do not know the mass of the peaks for a specific pattern, but you know the pattern of peaks relative to each other, e.g. isotopic patterns, you can use the variable X in place. For example:
QUERY scaninfo(MS2DATA) WHERE MS2PROD=X and MS2NL=X+16
Limiting Range of X
If you want to limit the range you can set another condition, X=range(min=100, max=500)
Limiting Mass Defect of X
If you want to set limits on the decimal part of X, you can set another condition, X=massdefect(min=0.1, max=0.5)
Molecular Formula
To save us all a little bit of time convert lookup of formulas into masses, you can use the syntax:
MS2PROD=formula(H2O)
to easily calcualte the mono isotopic mass of H2O. It will substitute as
MS2PROD=18.01056468403
Advanced Usage
If you want to make functions out of formula masses, you totally can, like below
MS2PROD=100 + formula(CH2)*2
Amino Acid Masses
To calculate amino acid masses, you can use the following syntax
MS2PROD=100 + aminoaciddelta(G)
which will calculate out to
MS2PROD=157.02146372057
Multiple Amino Acids
If you want to use multiple amino acids, no problem:
MS2PROD=aminoaciddelta(GA)
Peptide Masses
If you're in the proteomics camp, you can automatically calculate peptide fragementation.
MS2PROD=peptide(G, charge=1, ion=y)
will yield
MS2PROD=76.03930487103999
Filters
Filters are like conditional but we don't elimate scans based on the condition. Rather, we simply filter out peaks within the spectra.
This is useful for things like SRM or SIM/XIC.
Misc
OR operations
If you are looking for two peaks but either of them could be present, you can use the following syntax
MS2PROD=(100 OR 104)
You can use with variables as well.
With OR operations, you can specify multiple masses to look for. To give you more flexibility, you can require a minimum and maximum number of those masses to appear in a single mass spectrum. You can use the CARDINALITY qualifier to denote how many of the optional masses should appear. For example if 2 out of the 3 masses should appear:
MS2PROD=(100 OR 104 OR 106):CARDINALITY=range(min=2, max=2)
MassQL Patterns
If you're interested in doing some more advanced queries in MassQL, we have a dedicated patterns page to show you ways we've approached some interesting applications. By no means is it comprehensive, but we hope it helps. Check it out here.
Examples
XIC Generation
MS1 XIC, m/z = 100
QUERY scansum(MS1DATA) FILTER MS1MZ=100:TOLERANCEMZ=0.1
MS2 With Sugar Loss - Neutral Loss Scan
Neutral Loss, 163 Da
QUERY scaninfo(MS2DATA) WHERE MS2NL=163
Brominated Compounds
QUERY scaninfo(MS2DATA) WHERE
MS1MZ=X:INTENSITYMATCH=Y:INTENSITYMATCHREFERENCE
AND MS1MZ=X+2:INTENSITYMATCH=Y:INTENSITYMATCHPERCENT=5
AND MS2PREC=X
MS2 with distinct fragment(s) - Precursor Ion Scan
One Product Ion, m/z = 660.2
QUERY scaninfo(MS2DATA) WHERE MS2PROD=660.2:TOLERANCEMZ=0.1
Two Product Ions, m/z = 660.2 and 468.2
QUERY scaninfo(MS2DATA) WHERE MS2PROD=660.2:TOLERANCEMZ=0.1 AND MS2PROD=468.2:TOLERANCEMZ=0.1
How To Use MassQL
Python API
We have a python API that you can utilize in your own software. Checkout the package here on PyPi.
R API
We have an R implementation by the community, check it out here.
Commandline Utility
We have a standalone script that can execute queries on spectrum files that can be installed by the package PyPi.
Nextflow Workflow
We have a nextflow workflow to enable scalable queries across hundreds of thousands of mass spectrometry files.
ProteoSAFe Workflow
We have a proteosafe workflow that we have created that nicely integrates into GNPS - Try the beta here.
See more details here.
Workflow Details
There are several options that you probably will care about
- Extracting found MS scans as part of output, default this is off, if you want to do downstream molecular networking - turn this on
- If you want to run multiple queries together, you can now, just separate your queries with
|||and then results from multiple queries will be merged together
GNPS Repository Scale Queries
One of the powerful things with MassQL is the ability to scale up to huge amounts of data. Luckily at GNPS we have tons of data. You can use the above workflow to select datasets (or your own), with hundreds of files queriable at once. However, sometimes you want to go really big and search everything at once. We have these tools available but they currently require a large amount of compute and require special permissions. If you want to do repository scale queries, please contact Ming to collaborate on it.
PyOpenMS
You can checkout how to use MassQL In PyOpenMS here.
Web API
We have built out a web API for people to use, especially for parsing.
https://msql.ucsd.edu/parse?query=QUERY%20MS2DATA%20WHERE%20MS1MZ=100
Simply put in the query as a url encoded parameter and a JSON representation of the parse is returned.
Interactive Web Sandbox
Checkout the interactive sandbox here.
Debugging Your Query
I would recommend you check out the interactive sandbox listed above. One of the features here is we try to translate your MassQL query into a visualization and into English. Generally issues with queries run into problems with of misunderstanding what each condition and qualifier mean or setting your requirements a bit too strict. Both the visualization and translation to English helps with that.